Bluetooth Net Monitor
A newer version of the Bluetooth network monitor can be read about here, but I’d recommend carrying on reading this post first.
Whenever I want to see why a download is going a little slow or getting lag on an online game I’d have to log in to my routers web page or SSH in to see if its someone else in the house downloading/uploading, the net connection going wonky or just the server, this was a bit annoying to do, so I made this device to constantly show network statistics.
Monitor
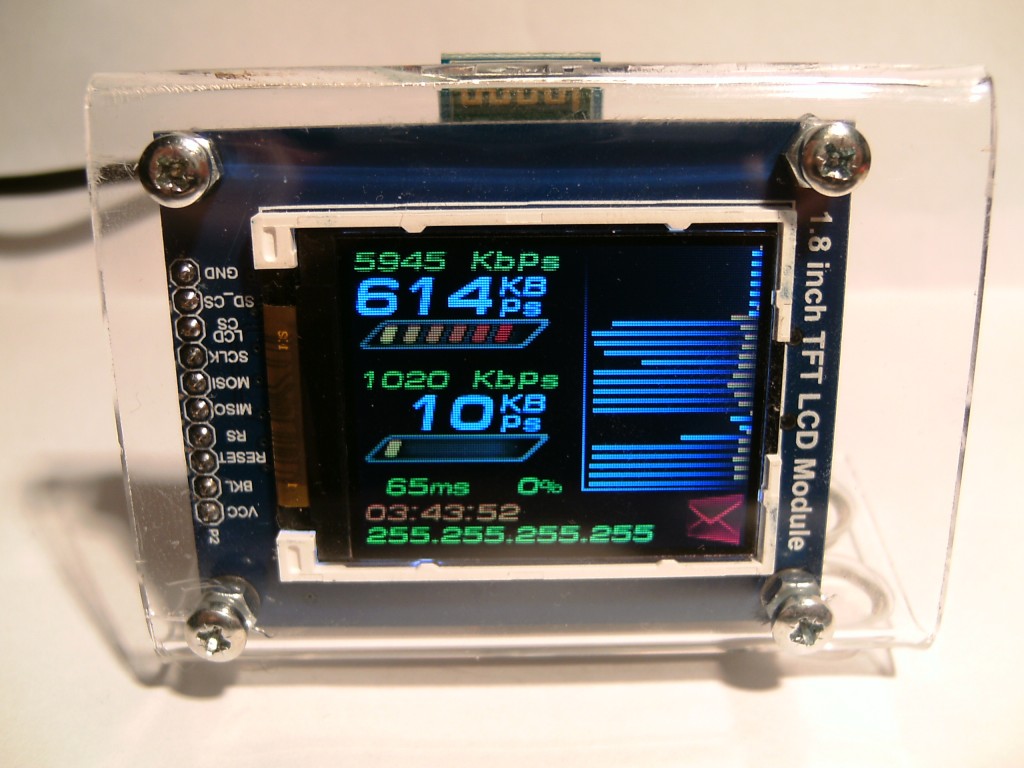
The monitor uses an ATmega328P @ 20MHz, 160×128 1.8″ colour LCD, a Bluetooth module, is powered by USB’s 5V, has a button for changing LCD brightness (long press) and display mode (short press) and since it’s powered by USB I added support for V-USB. The plastic part with everything screwed on to is an A8 paper display holder with the back clippy part removed and some rubber feet added.
The monitor has a few modes for displaying data:
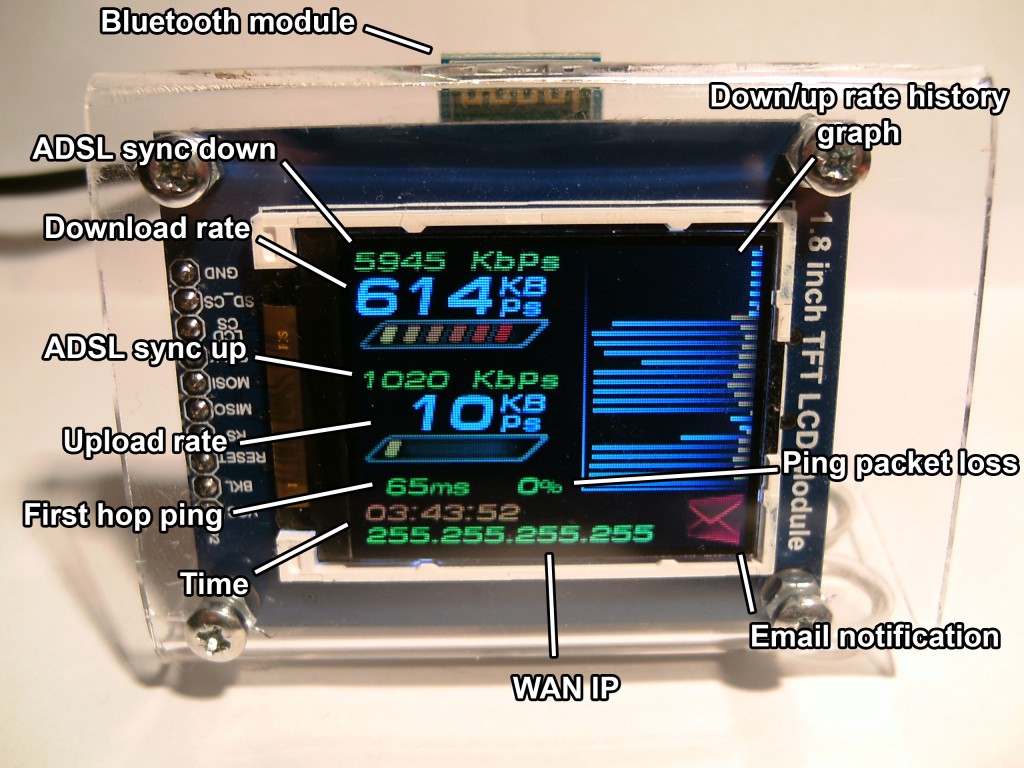
Display mode 1
- Down sync
- Up sync
- Down rate
- Up rate
- History graph for the past 25 seconds
- Ping
- Packet loss
- WAN IP
- Time
- Email notification
Display mode 2
- Down rate
- Up rate
- Large history graph for the past 40 seconds
I’ll probably add more display modes sometime, like showing CPU usage etc. from the PC that its getting power from by making use of V-USB.
Getting the data
The router (my router is a PC running Debian Linux) runs a shell script which gets down and up speeds of the WAN interface, first hop ping, ping packet loss, WAN IP and everything else, it then sends this data to a serial port (which in this case it’s a USB-to-serial converter using a CP2102) with a serial Bluetooth module attached, data is then sent to the other Bluetooth module in the net monitor which is then displayed on the LCD.
To get modem down and up sync speed a CGI script is ran on the modem, normally you’d have to parse the ADSL status page of the modem, but since I’m running OpenWRT on my Netgear DG834Gv3 I just needed to make a small shell script to get the ADSL status from a /proc file, well there is still a little bit of parsing, but not as much as you’d have to do with a normal HTML status page.
Protocol
The protocol used is a very simple text based one
$|syncdown|syncup|ratedown|rateup|ping|loss|ip|emails|date|time|*
Example:
$|6100|1020|340|4|19|0|255.255.255.255|2|Wed 02 Jan 13|20:31:26|*
Special characters:
$ – Start of packet
\* – End of packet
| – Delimiter to separate pieces of data
Other stuff
I might sometime code up a proper program in C instead of using a shell script, it’ll use up a lot less CPU time while running and make it possible/easier to use a more efficient binary protocol.
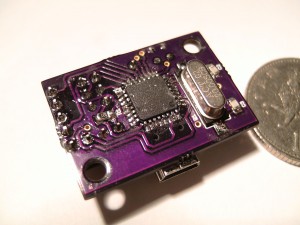
This was also my first experience with SMD parts (0805 size), I think it went very well, but little bit messy in some places, my future projects will probably be mostly SMD from now on.
I also made a small utility for converting the red channel of images into a byte array representing the intensity of each pixel, colour is added on-the-fly by the the controller based on the intensity, allowing multiple colours of the same image or font without using up extra flash space.

All the rendering takes quite a bit of processing time which is why the the chip is running at 20MHz, compiler settings and which compiler that is used also effects the performance, going from Atmel Studio 6’s default settings to using AVR-GCC 4.7.2, using these flags for the C compiler –
-O2 -fno-tree-scev-cprop -ffreestanding -mcall-prologues
and these flags for the linker –
-mrelax
reduces program size by around 2KB (now 16,836 bytes), saves 18 byes of RAM (now 301 bytes, that doesn’t count runtime stuff which tops at around 1KB) and gains a few extra FPS.
Using -Os instead of -O2 would give an even smaller code size, but at the cost of performance.
Sources available at GitHub
Video of the net monitor in early development – https://www.youtube.com/watch?v=W9UXh1g5AcA
Featured at
lifehacker, HackADay, Electronics Lab, Dangerous Prototypes


Comments